However, you’d be surprised what a quick peek at your hardware temperatures and usage numbers reveal about the efficiency of your system. To share a personal story, I recently found out that the GPU in one of my desktops was running at nearly 80°C while gaming – a temperature that will eventually cause harm over an extended period of time. Using vertical sync to cap my framerate provided a quick fix, and my GPU was cool again. There are a lot of different types of software that you can use to monitor your CPU or GPU, but who wants to constantly check a separate window or dedicate large space of a monitor to a bulky widget containing these statistics? If you’re a Windows user, there’s a solution: the system tray. Windows’ system tray provides space for icons that can change dynamically, making it the perfect place to watch the important numbers under the hood of your system. Using MSI Afterburner, you can do just that.
Download MSI Afterburner
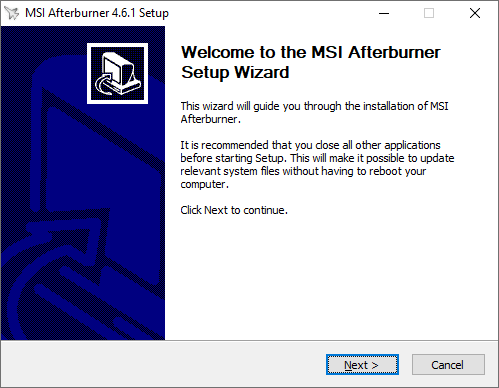
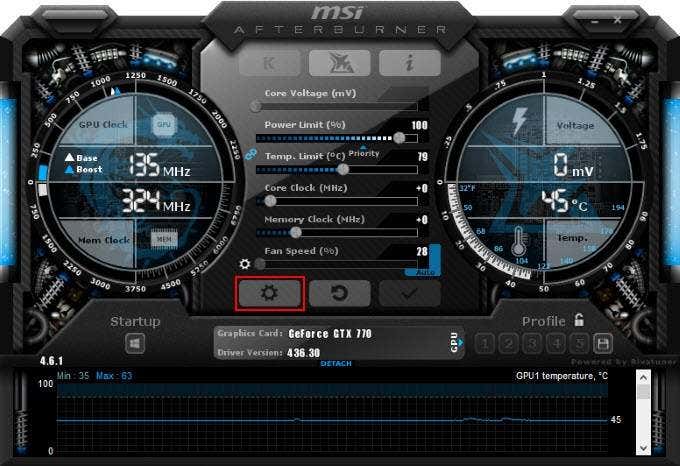
MSI Afterburner is the web’s top Windows software when it comes to overclocking your graphics card. It allows you to fine-tune how your graphics card and fans operate and is functional with all graphics card brands. However, overclocking can be scary and dangerous, and that’s not what this article is about. Rather than tinkering with your hardware and risk voiding the warranty, we’ll just be using MSI Afterburner as a way to show certain system statistics in the system tray. The download for MSI Afterburner is a bit over 40 MB in size, compressed as a ZIP archive. The archive will contain a binary setup file that will allow you to install the application on your system. Starting the application after installation is successful, you’re met with a user interface that feels fresh out of the early 2000s. It’s a dashboard that shows your GPU’s voltage, temperature, clock speeds, and more. From here, click on the cog icon to access MSI Afterburner’s settings. Here is where we’ll begin tinkering with MSI Afterburner so we can get at-glance hardware statistics in our system tray.
Monitor CPU or GPU with MSI Afterburner
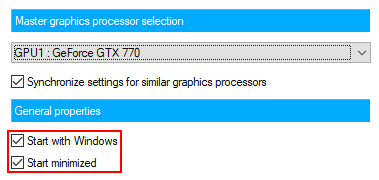
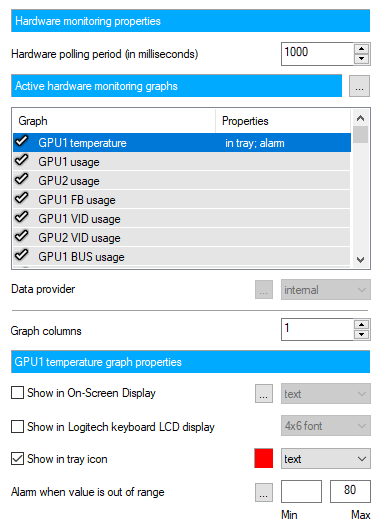
The window you’re immediately met with upon accessing MSI Afterburner’s settings has two important options you’ll want to make sure are enabled. Below the name of your GPU, you’ll see checkboxes to allow MSI Afterburner to start with Windows and minimized. If you’d like to be able to automatically monitor your CPU or GPU on each reboot, be sure that these are ticked. Next, navigate to the Monitoring tab of the settings window. Here, there are multiple settings that you’ll want to modify and experiment with. Under the Active hardware monitoring graphs heading, you’ll see a long, scrolling list of graphs that MSI Afterburner supports. These include, but are not limited to, your GPU’s temperature, usage, core clock, memory clock, power, and fan speed. There are also similar options for your CPU. As you can have multiple of these graphs enabled at a time, all of the settings below this heading are unique to the currently selected graph. That being said, you’ll first need to click on which graph you’re interested in displaying in your system tray. Once it’s highlighted, tick the Show in tray icon checkbox. You can show the icon as text or a bar graph, but I highly recommend using text – with a bar graph, the data becomes quite vague. You can additionally change the color of the text, by clicking the red square, and you can set up an alarm when the graph value is out of a specific range. The latter is great for alerting you when your video card may be preparing to overheat. Repeat this same step for each graph you’re interested in tracking and you should begin to see these icons appear in your system tray. If you don’t see any expected icons, it could be that they’re being hidden as an inactive system tray icon. To fix this, you can right-click on the taskbar, click on Taskbar settings, scroll down and click on Select which icons appear in the taskbar, and set each of your icons to always show. MSI Afterburner itself will also have an icon in your system tray (which looks like an airplane). If you don’t care about bringing up the visual dashboard, you can slim down on your system tray icons by going back into the settings, going to the User Interface tab, and ticking Single tray icon mode. This won’t combine all of your graphs into a single one, as the text suggests, but instead just remove the airplane icon. That’s it! Just like that, if you’ve enabled the option for MSI Afterburner to start with Windows, you’ll never again have to jump through hoops to see what your GPU temperature, CPU usage, and so many other values are. All it takes is a quick glance at your system tray.
![]()
![]()